Triangulation can help sustaining solutions and strengthening analysis.
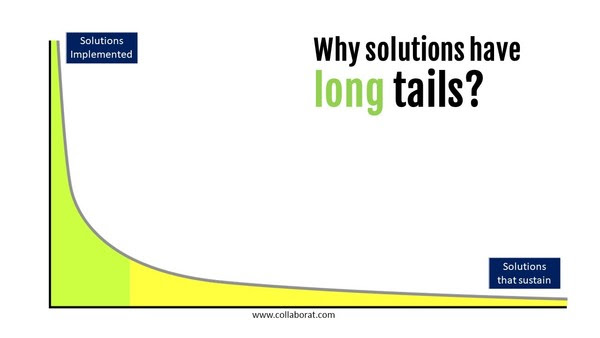
When your organization faces a problem, sooner or later, there will be an action plan in place to abet its elimination. The inconvenient truth about solutions is that they have long tails. Very, very few solutions actually stick. Most of them seem to be gone in months, sometimes even weeks and the problem bounces back. Yes, I’m talking about lack of permanence to the actions taken to improve performance.
There are several theories and in-depth research but, from my experience, I can say that things haven’t changed much in the last 2 decades. Whether it’s automation, change management, top-down push, leadership sponsorship, incentives, rewards, recognition or culture fix, all of them are marked by only a certain success rate.
My other post, On recurring problems, 3L 5W & what’s wrong with it… explains a method to identify system level root causes. Triangulation can be used for validation of root cause and to evaluate the effectiveness of any solution.
Validation through Triangulation
Triangulation is a method that involves combining multiple sources or methods to validate an analysis or its outcomes. We are used to taking a second opinion from another medical professional before committing to an incisional treatment. That is an everyday example of triangulation. The origin of triangulation dates back to Greek civilization. In the last 2 centuries, it is very commonly used in maritime navigation, civil engineering and surveying, where it relies on sound trigonometry. In fact our GPS uses this very same principle to establish the lat-long of a location. Triangulation is also a very popular research method to validate results, findings and even for monitoring the sustenance of interventions, such as social welfare initiatives.
In business while validating root causes, triangulation comes very handy. If we can validate the root cause by more than one means, it strengthens our analysis and confidence in our actions. Financially too, it makes sense, as ROI is higher.

I consider Triangulation as it can also generate new and credible findings about a situation or phenomenon and can create new ways of looking at a situation or phenomenon.
Interestingly, it helps to overcome human behavioral bias, which is the biggest spoiler when it comes to organizational deployment. It helps to explore and explain complex human behavior using a variety of methods and observers to offer a more balanced explanation for a phenomenon.
Customer Attrition Example for Triangulation:
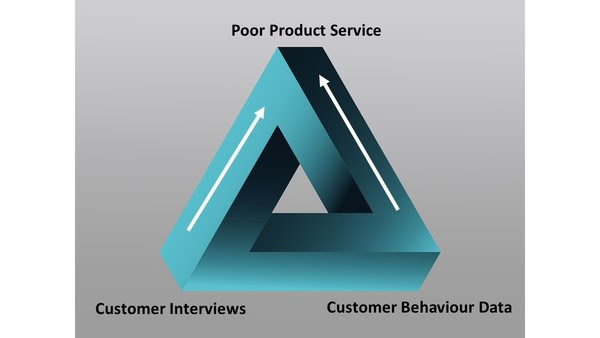
Let’s say, your organization faces unusual customer attrition. In general, you will collect and analyze data of customer activity by segments, such as customer journey, cart abandonment, milestones or events, complaints, etc to identify the reasons for customer attrition. Using triangulation, you can consider parallel methods such as customer interviews and front line employee interviews. You will independently gain insights from these 3 different methods viz., data, customer interviews & employee interviews to validate the outcomes. The results can either converge, complement or diverge from each other.
Interpretation of Triangulation Results
When all the three sources conclude that customer attrition is because of poor product support, we call this Convergence. That is, the results of the different methods lead to the same conclusion.
When all the three sources conclude that the customer attrition is because of poor product support, but in the customer interviews, we learn that customers prefer self-service which is a weak link of your product line, then triangulation has led to Complementarity.
When the three sources provide different outcomes, one pointing towards product support, another towards pricing and third towards customer behavior, then we are in a stalemate or Divergence. This is a concerning situation as it either highlights issues with the methods or with the very problem itself.
Triangulation Options
Depending on the objectives, triangulation can be done at different levels:
- Data Triangulation – Using different data sources to validate. Ex: Customer activity database vs Customer Satisfaction database
- Method Triangulation – Using different methods to validate. Ex: Data Analysis Vs Customer Interviews
- Investigator Triangulation – Using different individuals to validate there by eliminating appraiser bias
While triangulation offers many benefits, you have to be careful in selecting the right methods and planning the analysis. In general, it can consume more time that quick action mode, but will reduce failures, increase sustenance and success rates.
You can also consider triangulation for verifying sustenance of initiatives, selection of vendors or new employees
#nilakantasrinivasan-j #canopus-business-management-group #B2B-client-centric-growth #Triangulation
3L 5Why Analysis
3L 5Why Analysis is synonymous with Root Cause Analysis nowadays with most organizations having knowledge and know-how to perform 5 Why analysis. Most leaders encourage their leaders to use 5 why analysis to identify the root cause. That’s the good news!
Now the bad news 🙁 Most of the 5 Why analysis are incomplete and provide only tactical means to the current situation. They hardly look at underlying system level causes. If you don’t agree, list down all those problems in your organization that have been occurring for more than 5 years now, manifesting itself in some form or the other, in spite of a series of efforts year on year to arrest it. I have noticed that after some time, there is an innate acceptance in the organization that this problem is like the seasonal flu, it will keep coming again and again, we can’t do much other than taking precautions and facing it’s aftermath. In corporate, such perennial problems start off a mill of finger pointing rituals targeting other functions, individuals, company policy, customers, and even competition.
A comprehensive 5 Why Analysis should identify the systemic root cause of any problem. Some problems don’t need deep analysis at system level. Depending on the severity and occurrence of a problem, it should be possible to prioritize energies in identification of System level root causes wherever required.
3L 5Why analysis, represents 3 Level 5 Why analysis performed around the same symptom.
The 3 levels of the 5 Why analysis implies, performing 3 different 5 why analysis on the same problem from 3 different perspectives –
- Specific to the problem
- Specific to the detection mechanism
- Specific to the systemic issue
Here’s is how I use this method with my client projects and for coaching teams during my engagements (and it’s a little different from what others do with 3L 5 Why):
- Level 1 – Specific to the problem – Perform 5 Why analysis for the issue on hand. It can be related to customers, regulators, safety, quality , productivity or any other significant failure. Usually this is done by the people closest to the processes in question, essentially the doers and immediate team leaders. The purpose of this level 1 5 why analysis is to identify the root cause for why the problem on hand occurred. For ex: Lets say, your regulator has fined you for non-conformance in a standard laid out by them. Here, our focus will be on : Why did we get fined now?
- Level 2- Specific to the detection mechanism – Ideally this level of analysis has to be done by managers. They have laid out processes, controls, checks and balances to ensure critical issues are identified before it goes outside the organization. So the focus of this level of 5 why root cause analysis will be to identify the root causes for why the detection system allowed defects to pass downstream. Hence addressing this area will strengthen the control and governance system. For ex: Why did the transactions escape the automated checks, human checkers, approvers, auditors, process owners, etc
- Level 3 – Specific to the systemic issue – The last and highest level aims to look for systemic deficiencies that lead to the problem. From my experience, this requires a very good understanding of the entire value chain. Actually it also requires a candid acceptance of flaws in the enterprise such as culture issues, process deficiencies, silos, resourcing gap, ineffective leadership, etc. Ideal for senior leaders to deep dive to identify system level root causes. From my experience, this is best done at periodic intervals by combining the study of several similar L1 and L2 failures. Most of them converge to a handful of common system level root causes. Unfortunately, the hard hitting reality is that these are conveniently ignored. For ex, in the case of compliance issue we touched earlier, an example of system level cause is, employees are held accountable for their mistakes and it directly impacts their growth and C&B; And so most of them wish to cover up anything that occured, even if it was inadvertent.
There are several practical strategies that need to be developed to improve the effectiveness of 3L 5 Why analysis depending on culture, know-how, sector, etc.
Another important missing link to 3L 5Why analysis is the data based validation. It is almost impossible to get to the root cause by merely brainstorming. An ideal approach would be to use a triangulation method.
#nilakantasrinivasan-j #canopus-business-management-group #B2B-client-centric-growth #3L-5Why-Analysis #5Why-Analysis
How to measure the ROI and effectiveness of Learning Programs?
Many learning interventions, whether they are simple training programs or complex workshops involving multiple touchpoints, fall short of getting sufficient endorsement from business leaders. There can be several reasons & those might vary case to case, but one of the biggest issues with learning engagements is lack of data and supporting analytics to back the effectiveness of intervention.
Most large enterprises allocate more than 25% of the enterprise’s L&D budget for Technical skills development employees and partners (field sales & service), that is, annual technical training spend per employee (including hidden costs) varies anywhere between INR50,000 to INR4,00,000 depending on nature of business (technical or non-technical).

Usually technical skills have a high direct impact on top line performance and customer’s perception about brand, product & service quality. Luckily, they are also one of the easiest candidates to assess ROI.
Some of the common questions that business leaders ask are:
- How has the intervention helped in meeting business priorities? & How to isolate the effect of training?
- What is the Return on Investment (ROI) on L&D Interventions?
- How to measure the effectiveness of a training program?
- What is the retention of knowledge after a few months of interventions?
- Are we doing the right type of interventions? Should we design our interventions differently?
To this means, L&D leaders stumble on the following:
- Link Learning Goals to Business Goals?
- What to measure? How to analyze
- How to measure effectiveness in the field?
- How to differentiate between evaluating the learning interventions and the participants?
Kirk Patrick model for evaluating L&D interventions is a popular go-to technique for this program:
- Kirk Patrick Model Level 1 – Measure Reaction – Gather training feedback
- Kirk Patrick Model Level 2 – Learning – Evaluate participant knowledge and skills through post training assessment
- Kirk Patrick Model Level 3 – Behaviors – New skills that participant gaining in training that is being used in field
- Kirk Patrick Model Level 4 – Results or effectiveness – Business results directly relatable to the learning intervention
Obviously, all of them have their own pros and cons.
It is not possible to measure at Kirk Patrick Model L4 for all interventions and not necessary too.
As we live in a digital-data world, it lends itself to applying innovative methods and techniques to perform deep analysis and gain insights about the effectiveness of learning interventions and it improve learner’s engagement.
Here are few technology & analytics driven techniques:
- Learning Pulse measurement
- Descriptive Analytics & EDA to identify adoption issues
- Reaction & Feedback Analytics
- Verbatim Analytics using NLP models
- A/B Testing Experiment design
- Behavioral Analytics
- Analytics on sustenance
- Diagnostic Analytics
- Performance Modelling
- Predictive Modelling learning
- AR based learning assessments
And key steps to assessing ROI for L&D interventions are as follows:
- Decision on evaluation method across learning life cycle (training design, during & after training)
- Collecting Post-Training Data
- Isolating the Effects of Training
- Computing Monetary Value (Tangible, Preventive, etc) of training results
- Computing Learning Cost
- ROI Computation
Using a structured and well-thought through approach, L&D effectiveness and ROI can be improved drastically.
#nilakantasrinivasan-j #canopus-business-management-group #B2B-client-centric-growth #L&D
Data Based Mindsets – Maturity Levels

As of 2021, organizations have heavily invested in data infrastructure and supporting resources. But it’s grim to hear that nearly 85% of all data and analytics based transformation projects fail to meet their objectives.
There can be a long list of reasons for this state of affairs, but an undeniable contributor and a systematic issue is the organization’s culture – A lack of a Culture of Data Based Mindset.
Many times when we don’t know what is the problem with the organization, we tend to brand it as a cultural issue. So to say, the problem is attributed to Data Based Culture or lack of it, is a biased statement without going deeper into the issue.
The willingness of employees to accept & adapt to the new way of working. ie., taking decisions or actions based on data, is in fact the real barrier and reason for low adoption of data based transformation projects.
This is one of the new pillars of professional excellence – being fluent with data and making it an integral part of day to day actions.
Data Fluency, Data Literacy, Data based Mindset – whatever name we want to give, it boils down to how comfortable we are with data.
Like any other new technology – mobile, web applications, smart devices, social media, etc., we have a continuum of users of different maturity and proficiency in Data Based Mindset or Data Literacy too
If you wish to honestly self-assess or evaluate your team on where they stand when it comes to using data for decision making, a Data Based Mindset Maturity Model that covers data literacy maturity levels such as the one below will be very helpful. We’ll now look into the levels of Data Based Mindsets:
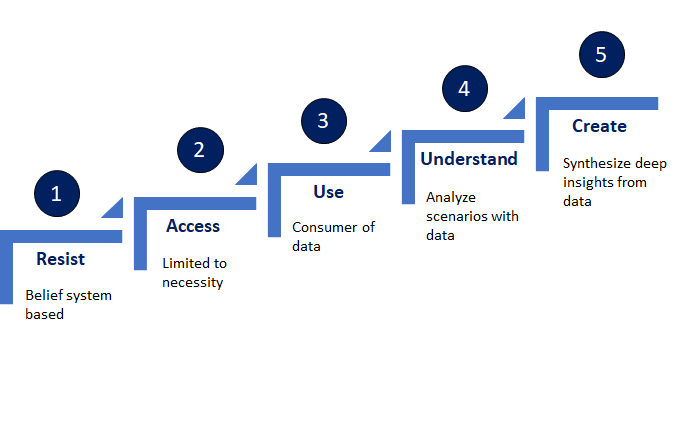
Resist – confused beginners
At this level, at heart, an individual is a disbeliever in data based decision making. Such individuals would hardly look into data but when they do so, they try to run a variety of logical counter-arguments to discredit data and its insights. One can say that they have a strong belief system that is anti-data or facts, which is based on biases, preconceived ideas of the situation, hear-say facts, anecdotal evidence, etc. Folks at this level offer maximum resistance to change. At the deepest level, it can be on account of fear of some kind. When an organization has many key stakeholders and king-pins in this bucket, the organization would more or less be a data-laggard. Ultimately they will have to take off from this level due to peer pressure and so ‘confused beginners’ is a fitting description for this group.
Access – social drinkers
At this second level, individuals are limited users of data, only based on necessity. I’m tempted to compare them with ‘social drinkers’. Situations and environment forces them to consider data and they do so with reluctance. Naturally, they are users with limited proficiency in data handling and are uncomfortable when placed in data rich discussions.
User – consumers and cheerleaders
Bulk of employees in organizations that are doing well today, fall into this group. They believe in data based decisions. So there is no mental block with this group. But they have skill limitations. I’m tempted to compare them with the audience and cheerleaders in a football match. They love the game, they enjoy and relish talking about it in great detail but they’ll always be in the stands and never put their foot on the playground. Either they don’t have the skill to play or they are too old or not physically fit for the sport. But being here is not that bad from an organization’s perspective. They are willing to consume data and inferences given to them and believe in it.
Understand – power users
They are individuals who have good expertise and are strong believers in data. They lead with data, whether it is about analysis, framing scenarios, statistical and probabilistic analysis, considering divergent views from data, they are very proficient. You can take them as ‘power users’. At extreme, they may tend to be ‘annoying experts’ too :-).
Create – prosumer
Standing at the highest maturity, this group may not be really senior in organizational hierarchy, but they definitely are good at synthesizing deep insights from data, applying unconventional & innovative methods to generate unique value propositions for business and customers that can disrupt the current state. They look through the data beyond the obvious. You can call them the ‘prosumer’. They are both the producers of insights and its consumers. As a result, they are the trend setters. Obviously there are going to be only a few fitting into this group.
This understanding of the Data Based Mindsets & Maturity Levels can be applied to evaluate its relevance to your industry, specific roles & departments and their ideal maturity states, skills needed and critical mass needed at each level to build a Data Based Mindset Culture, etc.
If you wish to learn more about evaluating your organization on Data Based Mindsets & Maturity Levels or create a roadmap, feel free to contact us.
#nilakantasrinivasan-j #canopus-business-management-group #B2B-client-centric-growth #Data-Based-Mindset #Maturity-models
There is a good chance that you haven’t heard of these terms – Managing Points and Checking Points or MPCP.
Now, we will talk about what are ‘MPCP’ and why they are needed, with an example.
In order for you to fully relate to MPCP, you will need to have some background in Daily Work Management and Standard Work.
In an organization, there would be two kinds of activities or goals – Run the Organization (Daily Work Management) and Change the Organization (Transformation or Improvement). For example, if you wish to sustain existing revenue, you would want to maintain or upkeep many process parameters and initiatives through regular management, reviews, support existing products with improvements, provide enabling tools, resources, etc. These fall under Daily Work Management. And when you wish to shift gears and accelerate the business and grow 10x, then you will be looking for Transformation, ie., developing new products, adding new facilities, hiring more people, acquiring new technology, etc.
Managing Points and Checking Points (MPCP) are part of the Daily Work Management routine. They are a set of accountability and responsibility areas for a given role in the organization, aimed mainly at sustaining current level. This could include small improvements to fix issues, address day to day issues, monitor current state of process, ensure there is no deterioration of performance, etc. One of the biggest goals of DWM is to reduce the variability in the output or in other words bring in consistency in the system.
You may be confused about how MPCP is different from Annual Goals or KRAs? Remember that MPCP is for a role and Annual Goals and KRAs are for individuals. Thus it is very unlikely that MPCP would change year on year for role, of course unless the role scope has changed. They are also independent of title.
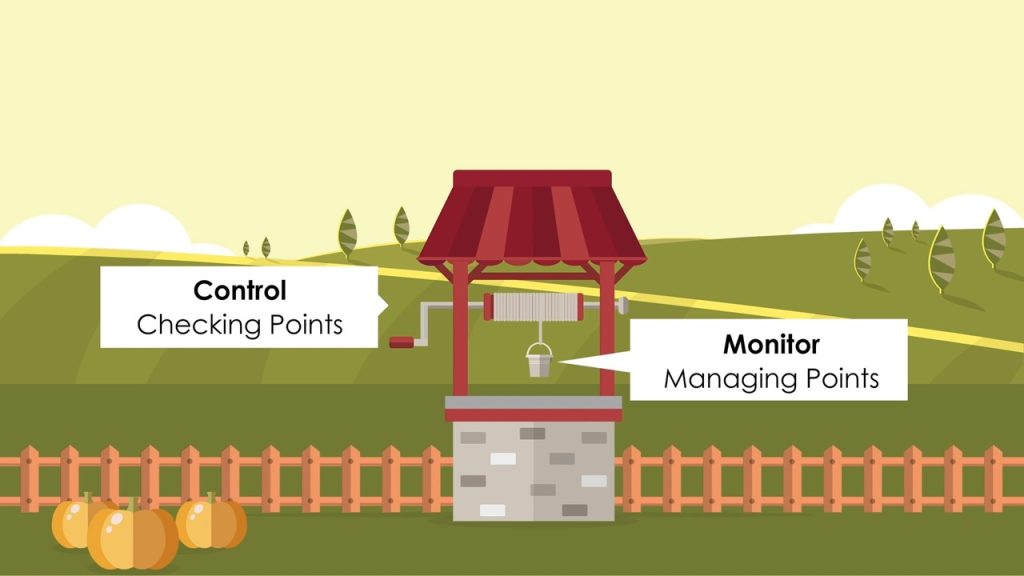
Now let’s understand Managing Points.
Managing Points are representative of accountability of any given role. For example, a CEO is accountable for business growth, employee engagement, compliance to law of the land, fair treatment to vendors, etc. So he/she has to oversee these aspects. He can’t tell the Board that my Sales Head had a bad year and so we didn’t meet the target. So Managing Points arise from the job description or role description. It also emanates from what the Board or his superiors want him/her to do. In case of any other employee in the organization, Managing Points (MP) are derived from 3 sources – Role description, Manager’s MP and Manager’s CP.
Now let’s move to Checking Points.
Checking Points are demonstrations of responsibility for any given role. These are metrics, tasks or activities that you will do to ensure your accountability is delivered. For example, a kindergarten teacher is accountable to ensure the kids are safe in the classroom. They don’t eat a crayon or anything like that. She will constantly check the classroom for littering, keep close watch on hyperactive kids, etc. So this becomes her responsibility. If I expand the definition of Checking Points (CP) a bit, then it covers input and process parameters, adherence to standard operating procedures (SOP), leading indicators of managing points so that necessary course correction can be done, etc.
A well designed MPCP system for any role should include 2 to 3 CPs for any MP and no more than 5-6 MPs for a role.
Let’s consider one more example of MPCP. Consider you are driving down to pick up your Chairman from the airport. He is visiting your country office for the first time after he took over and you don’t want to mess it up. It’s a 90 mile drive from your factory. You have a driver and a colleague with you. Your Managing Point will be to ensure you reach the airport on-time. Always remember Managing Points have to be measurable parameters. So what will be Checking Points (CP) for this Managing Point (MP)? The departure time from factory, route to be taken, when and where to stop over, average speed, who should be the driver, ensuring the car has all necessary travel documents, etc.,
Each one of the items mentioned here can become your Checking Point but usually the critical ones are prioritized. Some of them, you may choose to delegate to your secretary or empower the driver, in which case it may become their MP. But they are still your accountability.
Let’s say, the route you initially chose has congestion, you will ask the driver to take a different route and not stop-over to compensate for the time lost. Thus you have to measure or assess Checking Points (CP) more often than Managing Points (MPs) to get desired results.
I hope through this example, you were able to understand the importance and linkage between MP and CP.
In a large organization, MPCPs of various roles have to be interlinked. So MPCP plays the vital role of linking job responsibility, process standards and, link to manager or subordinate roles.
At Canopus, we have facilitated the development MPCP and some of most frequently asked questions from participants include:
- How is MPCP different from Annual Goal Sheets?
- How is MPCP different from Projects and Special Assignment?
- Will my MPCPs change every year?
- Can I assign MP or CP to my peers or other departments?
If you have similar questions, feel free to contact me and I’m happy to guide. You can also take self-paced online course Standard Work that will give you templates and many more examples.
#nilakantasrinivasan-j #canopus-business-management-group #B2B-client-centric-growth #MPCP
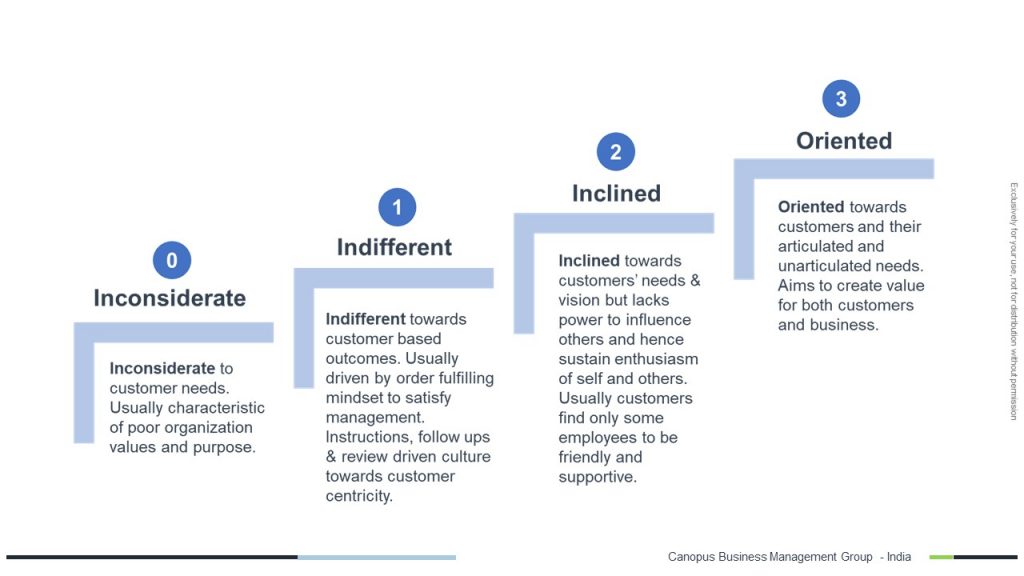
Canopus Customer Centricity in an organizational assessment to understand behavioral and cultural maturity of organization.
- It is a measure of Customer Centricity of organization across 8 dimensions using 4 maturity levels.
- Unlike traditional assessments, in this survey participants are given with 8 random scenarios and they have to select what they will do or feel in each of the situation. This way, it eliminates respondent bias.
Canopus Customer Centricity Maturity Levels are below:
- Use Chrome Browser for viewing
- Start from Welcome Page of report
- Use full screen
- Navigate across pages
- Use drop down to slice & dice the data to your convenience

While organizations like Disney and Ritz-Carlton have the luxury to hire front line staff based on Emotional Quotient (EQ), you will agree that not all of us have that levy. More importantly, in some sectors we have to weigh other skills such as technical, financial, engineering, software than EQ during hiring. For example, in product service, B2B front line, IT solutioning, etc., it is not a pragmatic aspiration to expect employees to possess high EQ & technical know-how.
Over the years, employees have understood the importance of customer centricity. So everyone wants to be customer centric but the question really is, how? Are the specific pointers that CXOs & HODs can give to their team on what to do? Motivating & inspiring them to do so is just as good as cranking the engine. What about throttling and shifting gears?
Unfortunately, there are very few leaders who go that far. If you want your employees to emulate certain behavior everytime-everyday, you have to be very specific and take a prescriptive approach.
Here are the 8 super simple behaviors that you can demonstrate every day, in meetings, field visits, reviews, planning, brainstorming sessions, or even when you scroll down a spreadsheet. Every customer facing employee (rather every employee) can be encouraged to imbibe these practices to become customer centric that will facilitate value generation for customers & business.
We will start with the simplest and go down to the difficult ones.
- Consistently deliver on promises: This is the simplest way to build trust and usually doesn’t cost much. And promises, whether big or small, are what we voluntarily make! So, it’s pretty much in our control.
- Permanent Issue Resolution: Whatever technology and processes we put in place, problems do crop up, every now and then. These issues are irritants for customers. Imagine, how many different products and services he/she uses. If we learn to go to the root of the customer issue and fix it permanently, we are not only helping this customer, but proactively preventing many such issues. This is when we can devote our energies towards constructive strategies.
- Collaborate together to fix customer issues: Organizations have become complex systems and authority is largely decentralized. Unless we collaborate internally and externally with all stakeholders, we will never put up a good show in front of customers.
- Listening to customers and understanding their needs: While it sounds very simple, it’s important to recognize every customer is unique. Furthermore, needs and requirements are very different. And lest, we have time to listen.
- Look for ways to make things better for our customers: Unearthing the unarticulated needs of customers pushes it by one more notch. Real and productive innovation starts here.
- Going out of way to help customers: We are trained to follow rules, processes and policies. Many a time, the biggest hindrance to customer centricity are none but these factors. The courage to challenge and break them when the situation really warrants is not short of heroism in Customer Centricity.
- Keep customers at the heart of our decisions: We are in business and not in charity, but when it comes to day to day decisions, do we weigh customers equally as business?
- Serve with Passion: While the first 6 points hinged on skill & action, the last two are about will. Conviction is born at the bottom of the heart.
If you wish to learn more about these 8 behaviors or how to create buzz around customer centricity in your organization, happy to be of help any time.
#nilakantasrinivasan-j #canopus-business-management-group #B2B-client-centric-growth #Customer-Centricity

Arun was a Regional Head for Channel Expansion & Relationship for a white goods manufacturer. This year he received an award for outstanding performance for a record appointment of new channel partners (distributors and retailers) in a region that was considered as a weak territory for the company. The CEO said that this was a recognition of his problem solving skills.
It all started last year with the company setting an ambitious target to expand its network. In the first 2 quarters, there wasn’t much break through in the channel appointment. Management decided to move Arun from another region to drive this goal. Arun is known as a messiah in the company. Whether it is revenue, market share growth, network expansion, new product penetration, he is known for miraculous improvements. He could turn deserts into oases. His patrons say he’s very systematic and focused. While his critics claim he micromanages things. Nonetheless, as predicted, within the remaining 2 quarters of the FY, Arun swiftly throttled the appointment of dealers and distributors, thereby exceeding the original annual target set, which at the end of 2nd quarter looked un-accomplishable. Management’s aspiration was nothing more than achieving half the annual target set in the beginning of the year, with only 2 quarters in hand. So messiah proved his metal again!
What did Arun do differently?
- He put a progress tracker in place
- He broke the partner appointment process into various milestones
- He ensured there is a daily review of all district appointment managers against the milestones.
- In the reviews, he will dig deeper and deeper into cases where there was doubt of closure.
- He personally spoke to prospective distributors and even visited a few in person
- He increased the local media advertisements calling for partners to join.
Though all this might sound very intrusive, the fact is he got it done!
All is not rosy about Arun. There is one minor problem in our Messiah. Whenever he is done and moves to another role or area, all the old problems crop up again. Arun used to take pride in this, that once he leaves things fall flat. He was sure this is a way to let the management realize his value.
Was Arun really a good problem solver? Or is he a trouble-shooter?
| Trouble-shooter | Problem Solver |
|---|---|
| Always fixing the performance is his/her goal | Defines what is really the problem to be solved |
| Provides short term fixes | Identifies the root causes of the problem |
| Focuses on improvement in output | Validates system level root causes with facts or data |
| Doesn’t openly share insights & only emphasizes on prognosis | Shares his/her findings & insights with others |
| Works in silos & uses his charisma as a leverage | Engages the stakeholders on ground to provide eradicate the problem permanently |
| Usually gives quick fixes as such solutions give results faster | Puts permanent solutions that are sustainable |
| Cadence is limited to his tenure | Create cadence to sustain the improved state beyond him |
| Keeps his team in suspense, fear & pressure | Makes it a Team Oriented Problem Solving (TOPS) approach |
I will allow you to decide where Arun fits better.
After all, he never examined why this territory had low network penetration? What is the perception of existing and prospective channel partners about the brand? Are existing channel partners profitable and satisfied? Is channel partner attrition a problem? What is it that the competitors are doing differently than us? What is the deficiency of channel management team in this region?
At best, he is a good mercenary.
More importantly, not everyone who gets things done are problem solvers. Simply put, true Problem Solvers leave everything a little better for others than they found it!
#nilakantasrinivasan-j #canopus-business-management-group #B2B-client-centric-growth #Problem-solver
Sign-up for collaborat newsletter