An interrelationship digraph, also called a relations diagram or network diagram, is a tool that depicts relationships among different elements, areas, or processes through a network of boxes and arrows. It is usually used by Six Sigma teams to understand cause-and-effect relationships among different factors of a problem.
Different factors associated with a problem are entered in boxes or written on sticky notes. Factors related to one another are placed close to each other. If any factor causes or influences any other factors, then an arrow is drawn from that factor to those affected factors. At the end of the exercise, the arrows are counted. Generally, boxes with the most arrows leading to them are the major issues. However, this is not a hard-and-fast rule. Sometimes, even key issues may have only a few arrows. Therefore, no issue should be ignored. Issues that have more outgoing arrows are regarded as major causes, whereas issues that have more incoming arrows are regarded as major effects.
Interrelationship digraphs are used by organizations in different situations for varying purposes.
They are generally used for:
- Analyzing any kind of relationship, besides cause-and-effect relationships.
- Analyzing complex issues involving several interrelated issues.
- Determining areas of improvement that will have the greatest impact on the
- Analyzing logical relationships.
- Analyzing problems where causes cannot be organized as hierarchies or matrices.
- Analyzing a problem that is believed to be caused by another problem.
- And, developing a better understanding of the relations identified using tools such as affinity diagrams.
In the previous topic, you created a tree diagram. Key issues identified must also be sorted in the order of their importance. A prioritization matrix helps determine the order for dealing with different issues or selecting solutions according to their relative importance. In this topic, you will create a prioritization matrix to identify crucial issues that require immediate attention.
You must prioritize key issues identified according to their importance to determine which issues or solutions are the most critical and need to be addressed first. Using a prioritization matrix, you can determine such crucial areas where Six Sigma projects need be implemented to improve your business processes.
What are Prioritization Matrices?
A prioritization matrix is a tool used for determining the most important issues or solutions. This tool can be used for any prioritization activity. In a Six Sigma project, it can be used for filtering or prioritizing either causes or solutions. For example, the cause-and-effect matrix is a prioritization matrix used for prioritizing causes, while the criteria-based matrix is used for prioritizing solutions.
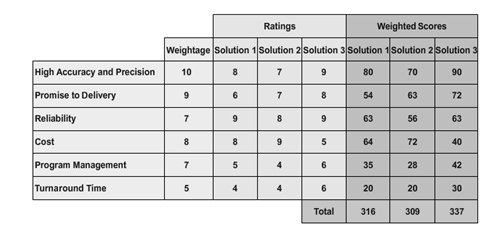
Whatever the matrix, the procedure used for prioritization is the same. The Six Sigma team identifies different criteria to be used for measuring different solutions. The relative importance of each criterion is determined and a numerical value indicating the weight of each criterion is entered in a column. Ratings are then assigned to the solutions against different criteria. The different solutions are scored against the identified criteria. Each rating is then multiplied by the criteria weights to obtain the weighted scores. The weighted scores are then added to find the cumulative value. The option with the highest total value is regarded as the option with the highest priority.
What are the use of Prioritization Matrices?
- Prioritizing complex issues involving several criteria against which the issues are assessed.
- Assigning scores to the criteria or issues when data is available.
- Choosing key areas to be focused upon immediately.
- And, garnering team support and approval of crucial issues.
How to Create a Prioritization Matrix?
To create a prioritization matrix for determining key areas where Six Sigma projects need be implemented first:
- Gather the team members required to participate in the exercise.
- It is not necessary to limit the team to only the project team members.
- Involve all stakeholders who would have influence on the items to be prioritized.
- Ideally, the size of the team should be around eight.
- Agree upon the scope and the duration of the exercise because there is a tendency to drift from the main subject of interest, which may consume more time.
- Identify criteria against which the items to be prioritized can be weighed. Select the criteria according to your business and the nature of the process.
- Assign weights to the criteria on a scale of 1 to 10.
- Use an ascending scale while assigning the weight. Usually, the higher the better.
- Draw consensus within the team on the weights.
- Assign ratings for each item to be prioritized against different criteria on a scale of 1 to 10. Alternatively, the team can also pick solutions one by one and gather votes for each criterion. Members who agree that a solution fits a particular criterion vote for it. Ensure that necessary information is available to the team before voting.
- Compute the total score for each item.
- Multiply the rating for an item by the weight.
- Add the total scores for each item.
- Continue doing this for every criterion of all the items.
- Shortlist the items with higher scores for implementation.
A matrix diagram, also called a matrix chart, is a management and planning tool used for identifying relationships between two to four groups of elements or among elements in a single group. The elements in different groups are placed in rows and columns and relationships among them are analyzed by the team.
Symbols indicating the strength of the relationships are then entered in the cell where the row and column of the two elements intersect. If there is no relationship, then it is left blank. Because matrix diagrams help you analyze data, they are also extensively used in the Measure and Analyze phases of the DMAIC methodology.
- Relationships among different sets of items by comparing them, especially many-to-many relationships among them instead of one-to-one relationships.
- The strength of the relationship between different sets of items qualitatively.
- And, the success of a process that generates one set of items from another set of items.
The Y-shaped matrix is a matrix diagram that relates three sets of elements where one set is related to the other two sets in a circular manner. . It can be formed by bending the columns of sets A and B in the T-matrix in such a way that there is an interrelation between the elements of these two sets.
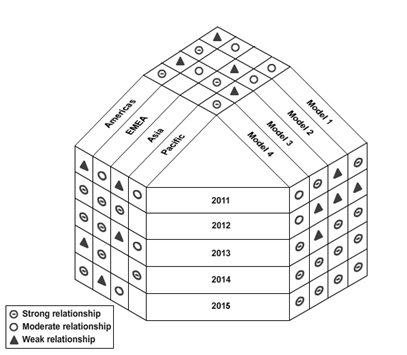
Fig: A Y-shaped matrix that summarizes the requirements for different models of photocopiers
Both DFMEA and PFMEA have similar principles and follow identical steps. Both involve identifying potential failures, their impact, and corrective measures to be taken for reducing or eliminating these potential failures
However, DFMEA and PFMEA differ in a few aspects, such as their focus and the stage in which these two analyses are done.
DFMEA focuses on potential failures related to product design changes. The main focus is on finding potential failures that can result in malfunctions and safety hazards while using the product. It is also applied to identify potential causes that may curtail the life of the product. It must be conducted throughout the entire design process, starting at the preliminary design as soon as the design concept has been selected to the production.
PFMEA focus on potential failures associated with processes and changes to them. The main focus is on finding potential failures related to a process that can affect the quality of a product or cause safety or environmental hazards and result in customer dissatisfaction. It is also applied to identify potential causes that reduce the reliability of the process.
| Item | Description |
| Focus |
|
| Stage |
|
- Improving quality to stay ahead of competition in the market. This is done by capturing customer requirements and redesigning operational processes to meet those requirements.
- Eliminating waste to make processes more efficient. This is done by eliminating activities that do not add any value to the product or service.
- Reducing variabilities and inconsistencies by standardizing processes and outputs.
- And, reducing costs by ensuring that production does not exceed customer demands. By preventing overproduction, organizations can also make sure that inventory costs do not increase.
| Principle | Description |
| Value | Defining the value |
| Value stream | Identifying the value stream |
| Flow | Creating flow in the value stream |
| Pull | Creating pull in the value stream |
| Perfection | Creating a continuous improvement culture |
| Leveling | Creating a balanced workflow |
| Standardized processes | Developing standards and following them |
| Kanban | Using a visual signaling system |
| Visual control | Using visual control methods |
| Quick changeover | Enabling the reduction of time |
| Defect prevention | Reducing the cost of poor quality |
Visual Factory in “Daily Work Management System For Managers Using Lean Methods”
In a Lean manufacturing process, time and resources spent on conveying data and information are regarded as waste. Visual factory tools—such as signs, charts, check sheets, and more— simplify information and reduce resources and time consumed to make it accessible.
Clear and concise real-time information and feedback regarding the status of a plant or a process is provided to shop floor employees using visual cues and tools. The visual cues provide unambiguous information needed to perform their jobs at a glance. Simple visual cues—such as color-coded pipes, wires, or flags; painted floor areas; and indicator lights—are simple to use and understand. The type of tool and the location used are determined by identifying the relevance and the information recipient.
Concept of Wastes as perceived in Lean Standard Work for Manufacturing
Organizations strive to eliminate three basic categories of waste in their business processes.
Basic Waste Category are:
- Wasteful activity – Work that adds no value to a product or service. Eliminating such activities from business processes will help organizations cut cost.
- Unevenness – This denotes inconsistencies that exist in a business process. Unevenness and inconsistencies can be avoided by eliminating inventory and supplying items to the production process only when they are needed.
- Overburden – This is caused by an unreasonable or excessive strain on resources. It can be eliminated by simplifying and standardizing processes.
Among these three basic categories of wastes, Lean focuses on eliminating activities that do not add any value. These activities are further classified into seven types of wastes: transport, inventory, motion, waiting, overproduction, over processing, and defects.
Is TQM relevant in the age of Artificial Intelligence & Industry 4.0?
Digital Transformation, Artificial Intelligence, Industry 4.0, IoT, RPA, etc are some of the buzz words that are bringing shivers in the spine of many executives. To be fair, actually many are excited about the future and the opportunities that these tools and methods present.
One side of the coin
A few months ago, in a conversation with the Head of Business Excellence of a MNC in manufacturing sector where TQM & other similar practices are deeply rooted, he said that this year their focus is Industry 4.0 and there are no budgets for any other initiative. He said that TQM, Lean Six Sigma, etc are concepts that are gone past their half life and in this new age, everything will be automated sooner or later. So no Kaizens will be needed, no Six Sigma DMIAC projects will be needed and so is Value Stream Mapping. And as automated processes are highly efficient, there will be no need for improvement projects. He had a point. Instead of dismissing the idea or accepting, it is good to consider how to navigate through these new age developments.
Now the other side of the coin
Another friend of mine who steers strategy and business development for a global digital transformation solutions provideracross sectors recently reached out to me. The quest was to find ways to help their clients to speed up the adoption of digital technologies and reduce internal resistance. He said the problem was to do with their culture. Here is a quick summary of what transpired:
- Internal acceptance and adoption is slow for digital transformation technologies and expected ROI remains an aspiration
- Digital Transformation is a journey and not a ‘fix it and forget it’ model. In reality, it is a continuum of iterative improvements leading to big transformation
- A successful Digital Transformation should devote 80% effort in people behavior change and only 20% in technology change
- To sustain Digital gains, every employee should wear the hat of improvement specialist such as a Six Sigma Black Belt.
- If every competitor of yours uses the same technology, you would have no definitive advantage. Ultimately what to differentiate and how to differentiate will come from your employees and technology will only be an enabler
- There is no substitute to employee engagement and involvement
So, there is no doubt that new Digital technologies will put you in a new orbit, but soon that orbit will become a slow lane. In the ’90s, ERP wave swept the industry, then it was CRM, and then BI, and then Cloud, and then Big Data, and now it is AI, Robotics & IoT.
So ultimately these technology tools enable business but nothing can beat an organization that has the following competencies ingrained in their culture:
- Leaders are grounded and their priorities are clear
- Everyone has a quest to challenge status quo and improve the way they work
- Employees treat and participate like one does in a family
- Business models are built around Customers and not Technology
- Decisions are factual & inclusive
Whether you call it Agile, DevOps, Six Sigma, Lean, TQM or BE, these frameworks rely on the same fundamental principles mentioned above.
So, to sum up TQM or any such Business Excellence frameworks are enablers for Digital Transformation and cannot be replaced by AI, IoT, Industry 4.0
After few months, when we talked again, he said they are strategizing on Industry 4.0 and not started any real work.
We have created an assessment to evaluate the Digital Transformation Culture of an organization. There are 3 broad areas –
- Leadership Aspiration Index – What leaders are aspiring vs reality
- Management Practices Index – What management practices are needed vs reality
- People Perception Index – What people think vs reality
![]()
Gap assessment will be in the following manner:
![]()
Sign-up for collaborat newsletter